
Personalised & optimised therapy (POT) algorithm using five cognitive and behavioural skills for subthreshold depression
The protocol paper16 and the primary analysis paper17 provide detailed information about the RESiLIENT trial (UMIN Clinical Trials Registry UMIN000047124, registered on 1 August 2022). The study was approved by Kyoto University Ethics Committee (C1556) on 3 March 2022.
Participants
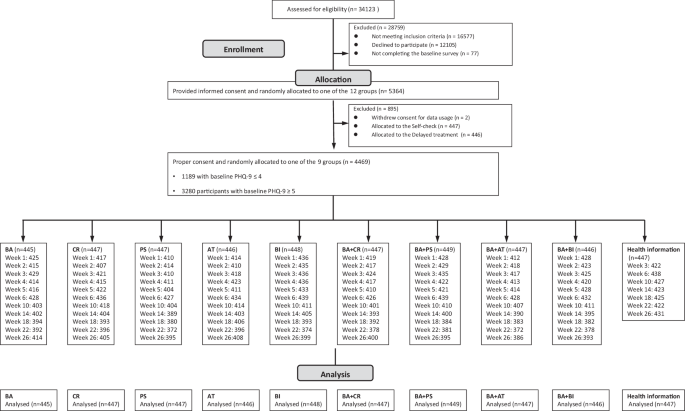
We recruited participants aged 18 years or older, of any sex, with the screening Patient Health Questionnaire-9 (PHQ-9) total scores of 0-14 inclusive but excluding those with total scores 10–14 and with suicidality (scoring 2 or 3 on its item 9). Scores of 0-4 on the PHQ-9 represent no to minimal, 5–9 mild, 10–14 moderate, 15–19 moderately severe, and 20–27 severe depressive symptoms.
Interventions and control
The RESiLIENT trial allocated participants to the following 12 arms in equal proportions. The Resilience Training App, developed for this trial (Supplementary Fig. 1), provided each arm as a six-week programme.
-
1.
BA (Behavioural activation): BA consists of psychoeducation about pleasurable activities and recommends personal experiments to test out new activities to see if they can bring some pleasure and/or sense of mastery.
-
2.
CR (Cognitive restructuring): CR teaches participants how to monitor their reactions to situations in terms of feelings, thoughts, body reactions and behaviours by filling in mind maps. The participant uses these mind maps to find alternative thoughts.
-
3.
PS (Problem solving): PS teaches participants how to solve a problem at hand through structured steps.
-
4.
AT (Assertion training): AT teaches the participant concrete methods to express their true feelings and wishes without hurting others or sacrificing themselves.
-
5.
BI (Behaviour therapy for insomnia): BI invites the participant to keep daily sleep records, based on which the participant would start applying sleep restriction and stimulus control techniques.
-
6.
BA + CR
-
7.
BA + PS
-
8.
BA + AT
-
9.
BA + BI
-
10.
Weekly self-check
-
11.
HI (Health information), which provided health information about exercise, nutrition and oral health on the app without weekly self-cheques or encouragement emails from the central office
-
12.
Delayed treatment
The original master protocol consisted of four 2 × 2 factorial trials16. In this study, however, we put together data from the nine active arms and one control arm to build prediction models and POT algorithms, because the clinical question for this secondary analysis was which of the nine active interventions were to be recommended in the POT algorithm. For the control condition we used the HI arm, because we reasoned that this would represent the “informed, health-conscious life as usual” and is arguably the most reasonable counterfactual condition against which we would like to know the added values of learning some cognitive or behavioural skills17.
Measures
All the assessments in this study have been completed by the participants on the app.
We measured the following baseline variables as potential PFs and EMs for iCBT skills, based on the literature and expert opinions18.
-
1.
Demographic variables
-
1.1
Age
-
1.2
Gender
-
1.3
Marital status
-
1.4
Number of co-habitants
-
1.5
Areal Deprivation Index (as estimated by the zip code in 2020)21
-
1.6
Education
-
1.7
Employment
-
1.8
Physical conditions and illnesses, including past and current treatments
-
1.9
Physical disability
-
1.10
Mental health conditions, including past and current treatments
-
1.11
Alcohol use and CAGE questionnaire22,23
-
1.12
Drinking habits, Exercise habits
-
1.1
-
2.
Psychosocial variables
-
2.1
Short form of the Big-5 questionnaire24,25,26
-
2.2
Adverse Childhood Experiences (ACE)27,28
-
2.3
Assessment of Signal Cases (ASC)-Life difficulties29
-
2.4
ASC-Social support29
-
2.5
CBT Skills Scale30
-
2.6
Readiness for smartphone CBT
-
2.6.1
ASC-Motivation29
-
2.6.2
Familiarity with smartphone usage
-
2.6.1
-
2.1
-
3.
Clinical variables
-
3.1
Patient Health Questionnaire-9 (PHQ-9)31
-
3.2
Generalised Anxiety Disorder-7 (GAD-7)32
-
3.3
Insomnia Severity Index (ISI)33
-
3.4
Short Warwick Edinburgh Mental Well-Being Scale (SWEMWBS)34,35
-
3.5
Work and Social Adjustment Scale (WSAS)36
-
3.6
EuroQOL-5D-5L (EQ-5D-5L)37,38
-
3.1
The outcome measure of interest in this study was the change in PHQ-9 scores from baseline to week 26.
Participants in the intervention arms filled in the PHQ-9 at weekly intervals between week 0 and week 6, and then every four weeks between week 6 and week 26. We chose week 26 as the target for optimisation, because the previous analyses found the effects of the interventions were maintained up to week 2617. When considering potential second-line interventions for individuals who do not respond to optimised treatments, week 26 represents the most reasonable and practical timing, and therefore a good target date for effect maximisation.
Procedures, random allocation, and blinding
We asked interested potential participants to log onto the web specifically prepared for the trial and fill in the screening questionnaire. Once we ascertained the minimum eligibility criteria, we invited all those scoring 5 or greater and one in ten of those scoring 4 or less on the screening PHQ-9 to the online informed consent session. Once individuals have agreed and signed their digital consent forms, we allow them access to the app by using their ID and password. Consenting individuals then had to complete all the baseline questionnaires within one week. After they completed all the baseline questionnaires, the app automatically randomised the participants to one of the ten intervention or control arms, stratified by the PHQ-9 scores (4 or less vs 5 or more) and their employment status (yes vs no), using the pre-installed permuted block randomisation sequence prepared by an independent statistician. Due to the nature of the intervention and the study procedure, neither the participants nor the trial management team were blinded to the intervention.
Analyses for group average outcomes per intervention
We used mixed-effects models for repeated-measures (MMRM) to estimate the least-squares means of change scores on the PHQ-9 for the nine interventions and the HI control up to week 26. The model included fixed effects of treatments, week (as categorical), and treatment-by-week interactions, adjusted for baseline PHQ-9 scores, stratification variables, age and gender. We adopted the unstructured correlation structure for the within-participant correlation coefficient matrix.
Prediction models for the week 26 outcome
We developed prediction models for predicting change scores of PHQ-9 at week 26 and individual treatment effects (ITEs) for the nine treatment regimens against the HI control.
One straightforward approach to develop multivariable prediction models based on the randomised trial dataset is to construct a prediction model using the baseline variables and their two-way interactions with the treatments. (Model 1)
An alternative strategy to improve the prediction is to add early post-randomisation variables to the prediction models (Model 2). Particularly, information about early responses to treatment has been shown repeatedly to improve the prediction performances39,40. In this study, four of the nine potential treatment alternatives (BA + CR, BA + PS, BA + AT, BA + BI) used the same component up to week 2. We could therefore add the PHQ-9 scores at weeks 1 and 2 as predictors for the week 26 outcome to recommend one of these four alternatives in the POT algorithms.
However, we may expect potentially sizable missingness for post-randomisation variables. Here we could add missing indicators to improve the prediction accuracy because missingness can be informative in itself41. (Model 3)
To evaluate the performance of alternative prediction models, we performed an internal validation using 10-fold cross-validation and calculated predictive accuracy measures including R2, R, bias, mean absolute error, root mean squared error, calibration-in-the-large, and calibration slope42.
Our multivariable prediction models incorporated a large set of covariates and their interactions with the treatments. To handle this large number of parameters, we need effective variable selection and adjustment of the model complexity43. We therefore tried various machine learning approaches, including RIDGE, LASSO, elastic-net, support vector machine, and causal forest, for the predictive analyses. We compared the internal validity via ten-fold cross-validation of these approaches for Model 1, and found that the LASSO regularisation approach performed the best for the RESiLIENT trial (Supplementary Table 9). In the following analyses we therefore adopted this approach for the primary analyses44.
There was little missing data among the baseline covariates (47 (1.1%) for exercise habits, 1 (0.0%) for number of cohabitants, 1 (0.0%) for education) but there was more missingness for weeks 1 and 2 PHQ-9 scores. Moreover, for the HI group, PHQ-9 scores were not measured at weeks 1 and 2. In addition, 443 or 9.9% of the intention-to-treat cohort (n = 4469) did not report their week 26 outcome.
We used multiple imputation using repeated measurements of the PHQ-9 between week 1 and week 22 as auxiliary variables to impute week 26 outcomes (for all models) as well as weeks 1 and 2 outcomes (for Models 2 and 3). We used the chained equation approach to generate imputation data45 and performed 100 imputations for all of the analyses.
To evaluate the generalisability of the model, we conducted internal-external cross-validation that splits the overall population via non-random mechanism, incorporating some characteristics of external validation43. In the RESiLIENT trial, we recruited participants from various sources, and they differed in participant characteristics, measured as well as unmeasured, from one source to another. Typically we advertised our trial at new sites each month, and the recruitment from each site lasted for one to two months. In other words, participant characteristics changed every month. We therefore deemed it possible to test the internal-external validity of our model by dividing the sample into ten temporarily consecutive subsamples.
The POT algorithm and its randomised validation
To select the best treatment for each individual, we could use the LASSO-based ITE estimates of individual participants when they received each of the nine interventions in comparison with the control46. However, the point estimates of ITEs do not reflect precision information, and relying solely on the ITE point estimates can lead to suboptimal treatments47. To incorporate the statistical errors of information around ITE point estimates, we calculated the probability to be the best treatment (PrBest) for each of the nine treatments for each participant. The PrBest is estimated as a relative frequency for the ITE estimates to be the largest among the nine treatments on the bootstrap replications (we performed 1000 replications) for each participant.
We then constructed three tables of POTs for participants with baseline PHQ-9 scores ≤4 and ≥5 separately, using the prediction model with baseline variables only (Model 1) or the prediction model with data up to week 2 (Model 2 or 3).
We then compared the week 26 outcomes among (i) those who had been randomly allocated to the HI arm in the original RESiLIENT trial, (ii) those who had been allocated to the group average best arm, and (iii) those who had been allocated to their POT arm, and calculated the improvement in the week 26 PHQ-9 change scores as (iii) – (i) / (ii) – (i).
Because in the RESiLIENT trial allocation to (i) through (iii) is randomised, these comparisons can be considered a simulated randomised trial. We could use information up to week 2 (Model 2 or 3) and still maintain randomisation if we used such models to choose only from among two-skill interventions because all two-skill interventions used the same BA lessons up to week 2. Because we used the 10-fold cross-validation framework to calculate the PrBest, in which we determined the best treatment for each individual as the treatment that has the largest PrBest among the nine treatments according to the model developed with the training set, these comparisons are corrected for optimism. We avoided data leakage because we conducted the tuning of LASSO prediction models with 10-fold cross-validations in the training sets. All missing data were addressed by multiple imputations in the model development phase, and we adopted the multiple-imputation-then-deletion (MID) strategy in these analyses48. We used robust variances to calculate confidence intervals of the effect sizes due to the potential heterogeneities.
We restricted the interventions to be included in the POT algorithms in several patterns. We determined the final POT algorithm, taking into consideration not only the increase in the total efficacy by administering the interventions as per the POT algorithm over administering the group-average best for everyone in the group, but also the feasibility and simplicity of the interventions to be recommended. Simplicity and feasibility are important considerations for scalable interventions.
Software and codes
We used the R packages glmnet ver. 4.1-8 for RIDGE, LASSO, and elastic-net, e1071 ver. 1.7-16 for support vector machine, grf ver. 2.4.0 for causal forest, and mice ver. 3.17.0 for the multiple imputation analyses.